FAQ
This list of questions is not exhaustive. If you have any other questions please email any authors on the Contact page.
How to cite scREAD?
Jiang, Jing, Cankun Wang, Ren Qi, Hongjun Fu, and Qin Ma. “ScREAD: A Single-Cell RNA-Seq Database for Alzheimer’s Disease.” IScience 23, no. 11 (November 20, 2020): 101769. https://doi.org/10.1016/j.isci.2020.101769.
What is Alzheimer’s disease?
Alzheimer’s disease (AD) is the most common cause of dementia, accounting for an estimated 60% to 80% of cases. Currently, there are an estimated 5.8 million Americans age 65 or older suffering from AD. Difficulty in remembering recent conversations, names, or events is often an early clinical symptom. The hallmark pathologies of Alzheimer’s disease are the accumulation of the protein fragment beta-amyloid (plaques) outside neurons in the brain and twisted strands of the protein tau (tangles) inside neurons. These changes are accompanied by the death of neurons and damage to brain tissue. Alzheimer’s is a slowly progressive brain disease that begins many years before symptoms emerge. Unfortunately, there are no effective therapeutics for the prevention and treatment of the disease. (2020 Alzheimer’s Disease Facts and Figures)
What is single-cell RNA sequencing?
Single-cell RNA sequencing (scRNA-Seq) examines the dynamic transcriptomic profile of individual cells with next-generation sequencing technologies, and hence provide a higher resolution of cellular differences and a better understanding of the function of an individual cell in the context of its microenvironment. The scRNA-Seq can reveal complex and rare cell populations, uncover regulatory relationships between genes, and track the trajectories of distinct cell lineages in development. The scRNA-Seq is becoming widely used across biological disciplines including neuroscience. More recently, scRNA-Seq has been used in the field of AD and significantly improves our understanding of the pathogenesis of AD at the single-cell level.
What is scREAD?
scREAD (single-cell RNA-Seq database for Alzheimer’s Disease), as far as we know, is the first database dedicated to the management of all existing scRNA-Seq and single-nucleus RNA-sequencing (snRNA-Seq) datasets from human postmortem brain tissue with AD and mouse models with AD pathology. By manually curating 15 AD-related studies, six scRNA-Seq datasets and 11 snRNA-Seq datasets were retrieved with the following factors well-annotated, i.e., organism, gender, brain region, disease/control, and age information. scREAD re-defines the 17 scRNA-Seq & snRNA-Seq datasets into 73 datasets (in total 713,640 cells and nine cell types), each of which corresponds to a specific organism (human or mouse), gender (male or female), brain region (entorhinal cortex, prefrontal cortex, superior frontal gyrus, cortex, cerebellum, cerebral cortex, or hippocampus), disease or control, and age stage (seven months, 15 months, or 20 months for mice, and 50-100+ years old for human). These datasets have been published and freely accessible in the public domain as of September 22nd, 2020. Furthermore, scREAD provides comprehensive analysis results and interactive visualizations based on all the collected AD datasets. Moreover, scREAD allows users to submit a new dataset to reproduce all the analyses results showcased in scREAD in support of their AD research. It is freely and openly accessible to all users with no login or registration required and no password-protected.
Which browsers are supported?
The browsers that scREAD supported are Google Chrome, Safari, and Firefox. The scREAD is not supported by the Internet Explorer browser.
Which species are covered in scREAD?
Human and Mouse.
Which brain regions are covered in scREAD?
For the human species, the scREAD covers four regions. For mouse species, the scREAD covers six regions. The detailed information is shown in the following table:
| Species | Region | Brodmann area |
|---|---|---|
| Human | Entorhinal cortex | NA; NA |
| Human | Prefrontal cortex | Area 9, Area 46; Area 10 |
| Human | Superior frontal gyrus | Area 8 |
| Human | Superior parietal lobe | NA |
| Mouse | Cortex | NA |
| Mouse | Cerebellum | NA |
| Mouse | Cerebral cortex | NA |
| Mouse | Hippocampus | NA |
| Mouse | Prefrontal cortex | NA |
| Mouse | Subventricular zone | NA |
Note: We separated the mouse brain region of cortex from the cerebral cortex because the corresponding datasets used different mouse models.
What are the data sources in scREAD?
The scREAD contains six human and 11 mouse AD scRNA-Seq & snRNA-Seq datasets that are collected from GEO and Synapse databases as of September 22nd, 2020. The detail information is shown in the following table
| Species | Data_ID | Pubmed_ID | Publication |
|---|---|---|---|
| Human | GSE138852 | PMID: 31768052 | Grubman A, Chew G, Ouyang JF, Sun G et al. A single-cell atlas of entorhinal cortex from individuals with Alzheimer’s disease reveals cell-type-specific gene expression regulation. Nat Neurosci 2019 Dec;22(12):2087-2097. |
| Human | syn18485175 | PMID: 31042697 | Mathys, H., Davila-Velderrain, J., Peng, Z. et al. Single-cell transcriptomic analysis of Alzheimer’s disease. Nature 570, 332–337 (2019). https://doi.org/10.1038/s41586-019-1195-2 |
| Human | GSE147528 | NA | Leng K, Li E, Eser R, et al. Molecular characterization of selectively vulnerable neurons in Alzheimer’s Disease. bioRxiv; 2020. DOI: 10.1101/2020.04.04.025825. |
| Human | syn21125841 | PMID: 31932797 | Zhou Y, Song WM, Andhey PS, Swain A et al. Human and mouse single-nucleus transcriptomics reveal TREM2-dependent and TREM2-independent cellular responses in Alzheimer’s disease. Nat Med 2020 Jan;26(1):131-142. |
| Human | GSE129308 | NA | Single-soma transcriptomics of tangle-bearing neurons in Alzheimer’s disease reveals the signatures of tau-associated synaptic dysfunction Marcos Otero-Garcia, Yue-Qiang Xue, Tamara Shakouri, Yongning Deng, Samuel Morabito, Thomas Allison, William E. Lowry, Riki Kawaguchi, Vivek Swarup, Inma Cobos bioRxiv 2020.05.11.088591; doi: https://doi.org/10.1101/2020.05.11.088591 |
| Human | GSE146639 | NA | Profiling microglia from AD donors and non-demented elderly in acute human post-mortem cortical tissue Astrid M. Alsema, Qiong Jiang, Laura Kracht, Emma Gerrits, Marissa L. Dubbelaar, Anneke Miedema, Nieske Brouwer, Maya Woodbury, Astrid Wachter, Hualin S. Xi, Thomas Möller, Knut P. Biber, Susanne M. Kooistra, Erik W.G.M Boddeke, Bart J.L. Eggen bioRxiv 2020.03.18.995332; doi: https://doi.org/10.1101/2020.03.18.995332 |
| Mouse | GSE98969 | PMID: 28602351 | Keren-Shaul H, Spinrad A, Weiner A, Matcovitch-Natan O et al. A Unique Microglia Type Associated with Restricting Development of Alzheimer’s Disease. Cell 2017 Jun 15;169(7):1276-1290.e17. |
| Mouse | GSE103334 | PMID: 29020624 | Mathys H, Adaikkan C, Gao F, Young JZ et al. Temporal Tracking of Microglia Activation in Neurodegeneration at Single-Cell Resolution. Cell Rep 2017 Oct 10;21(2):366-380. |
| Mouse | GSE130626 | PMID: 31902528 | Nugent AA, Lin K, van Lengerich B, Lianoglou S et al. TREM2 Regulates Microglial Cholesterol Metabolism upon Chronic Phagocytic Challenge. Neuron 2020 Mar 4;105(5):837-854.e9. |
| Mouse | GSE141044 | PMID: 31928331 | Zhong S, Wang M, Zhan Y, Zhang J et al. Single-nucleus RNA sequencing reveals transcriptional changes of hippocampal neurons in APP23 mouse model of Alzheimer’s disease. Biosci Biotechnol Biochem 2020 May;84(5):919-926. |
| Mouse | GSE140510 | PMID: 31932797 | Zhou Y, Song WM, Andhey PS, Swain A et al. Human and mouse single-nucleus transcriptomics reveal TREM2-dependent and TREM2-independent cellular responses in Alzheimer’s disease. Nat Med 2020 Jan;26(1):131-142. |
| Mouse | GSE140399 | PMID: 31932797 | Zhou Y, Song WM, Andhey PS, Swain A et al. Human and mouse single-nucleus transcriptomics reveal TREM2-dependent and TREM2-independent cellular responses in Alzheimer’s disease. Nat Med 2020 Jan;26(1):131-142. |
| Mouse | GSE143758 | PMID: 32341542 | Habib, N., McCabe, C., Medina, S. et al. Disease-associated astrocytes in Alzheimer’s disease and aging. Nat Neurosci (2020). https://doi.org/10.1038/s41593-020-0624-8 |
| Mouse | GSE147495 | PMID: 32320664 | Lau SF, Chen C, Fu WY, et al. IL-33-PU.1 Transcriptome Reprogramming Drives Functional State Transition and Clearance Activity of Microglia in Alzheimer’s Disease. Cell Rep. 2020;31(3):107530. doi:10.1016/j.celrep.2020.107530 |
| Mouse | GSE150358 | PMID: 32579671 | Wang S, Mustafa M, Yuede CM, Salazar SV, Kong P, Long H, Ward M, Siddiqui O, Paul R, Gilfillan S, Ibrahim A, Rhinn H, Tassi I, Rosenthal A, Schwabe T, Colonna M. Anti-human TREM2 induces microglia proliferation and reduces pathology in an Alzheimer’s disease model. J Exp Med. 2020 Sep 7;217(9):e20200785. doi: 10.1084/jem.20200785 |
| Mouse | GSE142853 | PMID: 32503894 | Zhang Y, Fung ITH, Sankar P, Chen X, Robison LS, Ye L, D’Souza SS, Salinero AE, Kuentzel ML, Chittur SV, Zhang W, Zuloaga KL, Yang Q. Depletion of NK Cells Improves Cognitive Function in the Alzheimer Disease Mouse Model. J Immunol. 2020 Jul 15;205(2):502-510. doi: 10.4049/jimmunol.2000037. Epub 2020 Jun 5. |
| Mouse | GSE142858 | PMID: 32503894 | Zhang Y, Fung ITH, Sankar P, Chen X, Robison LS, Ye L, D’Souza SS, Salinero AE, Kuentzel ML, Chittur SV, Zhang W, Zuloaga KL, Yang Q. Depletion of NK Cells Improves Cognitive Function in the Alzheimer Disease Mouse Model. J Immunol. 2020 Jul 15;205(2):502-510. doi: 10.4049/jimmunol.2000037. Epub 2020 Jun 5. |
How many data files are covered?
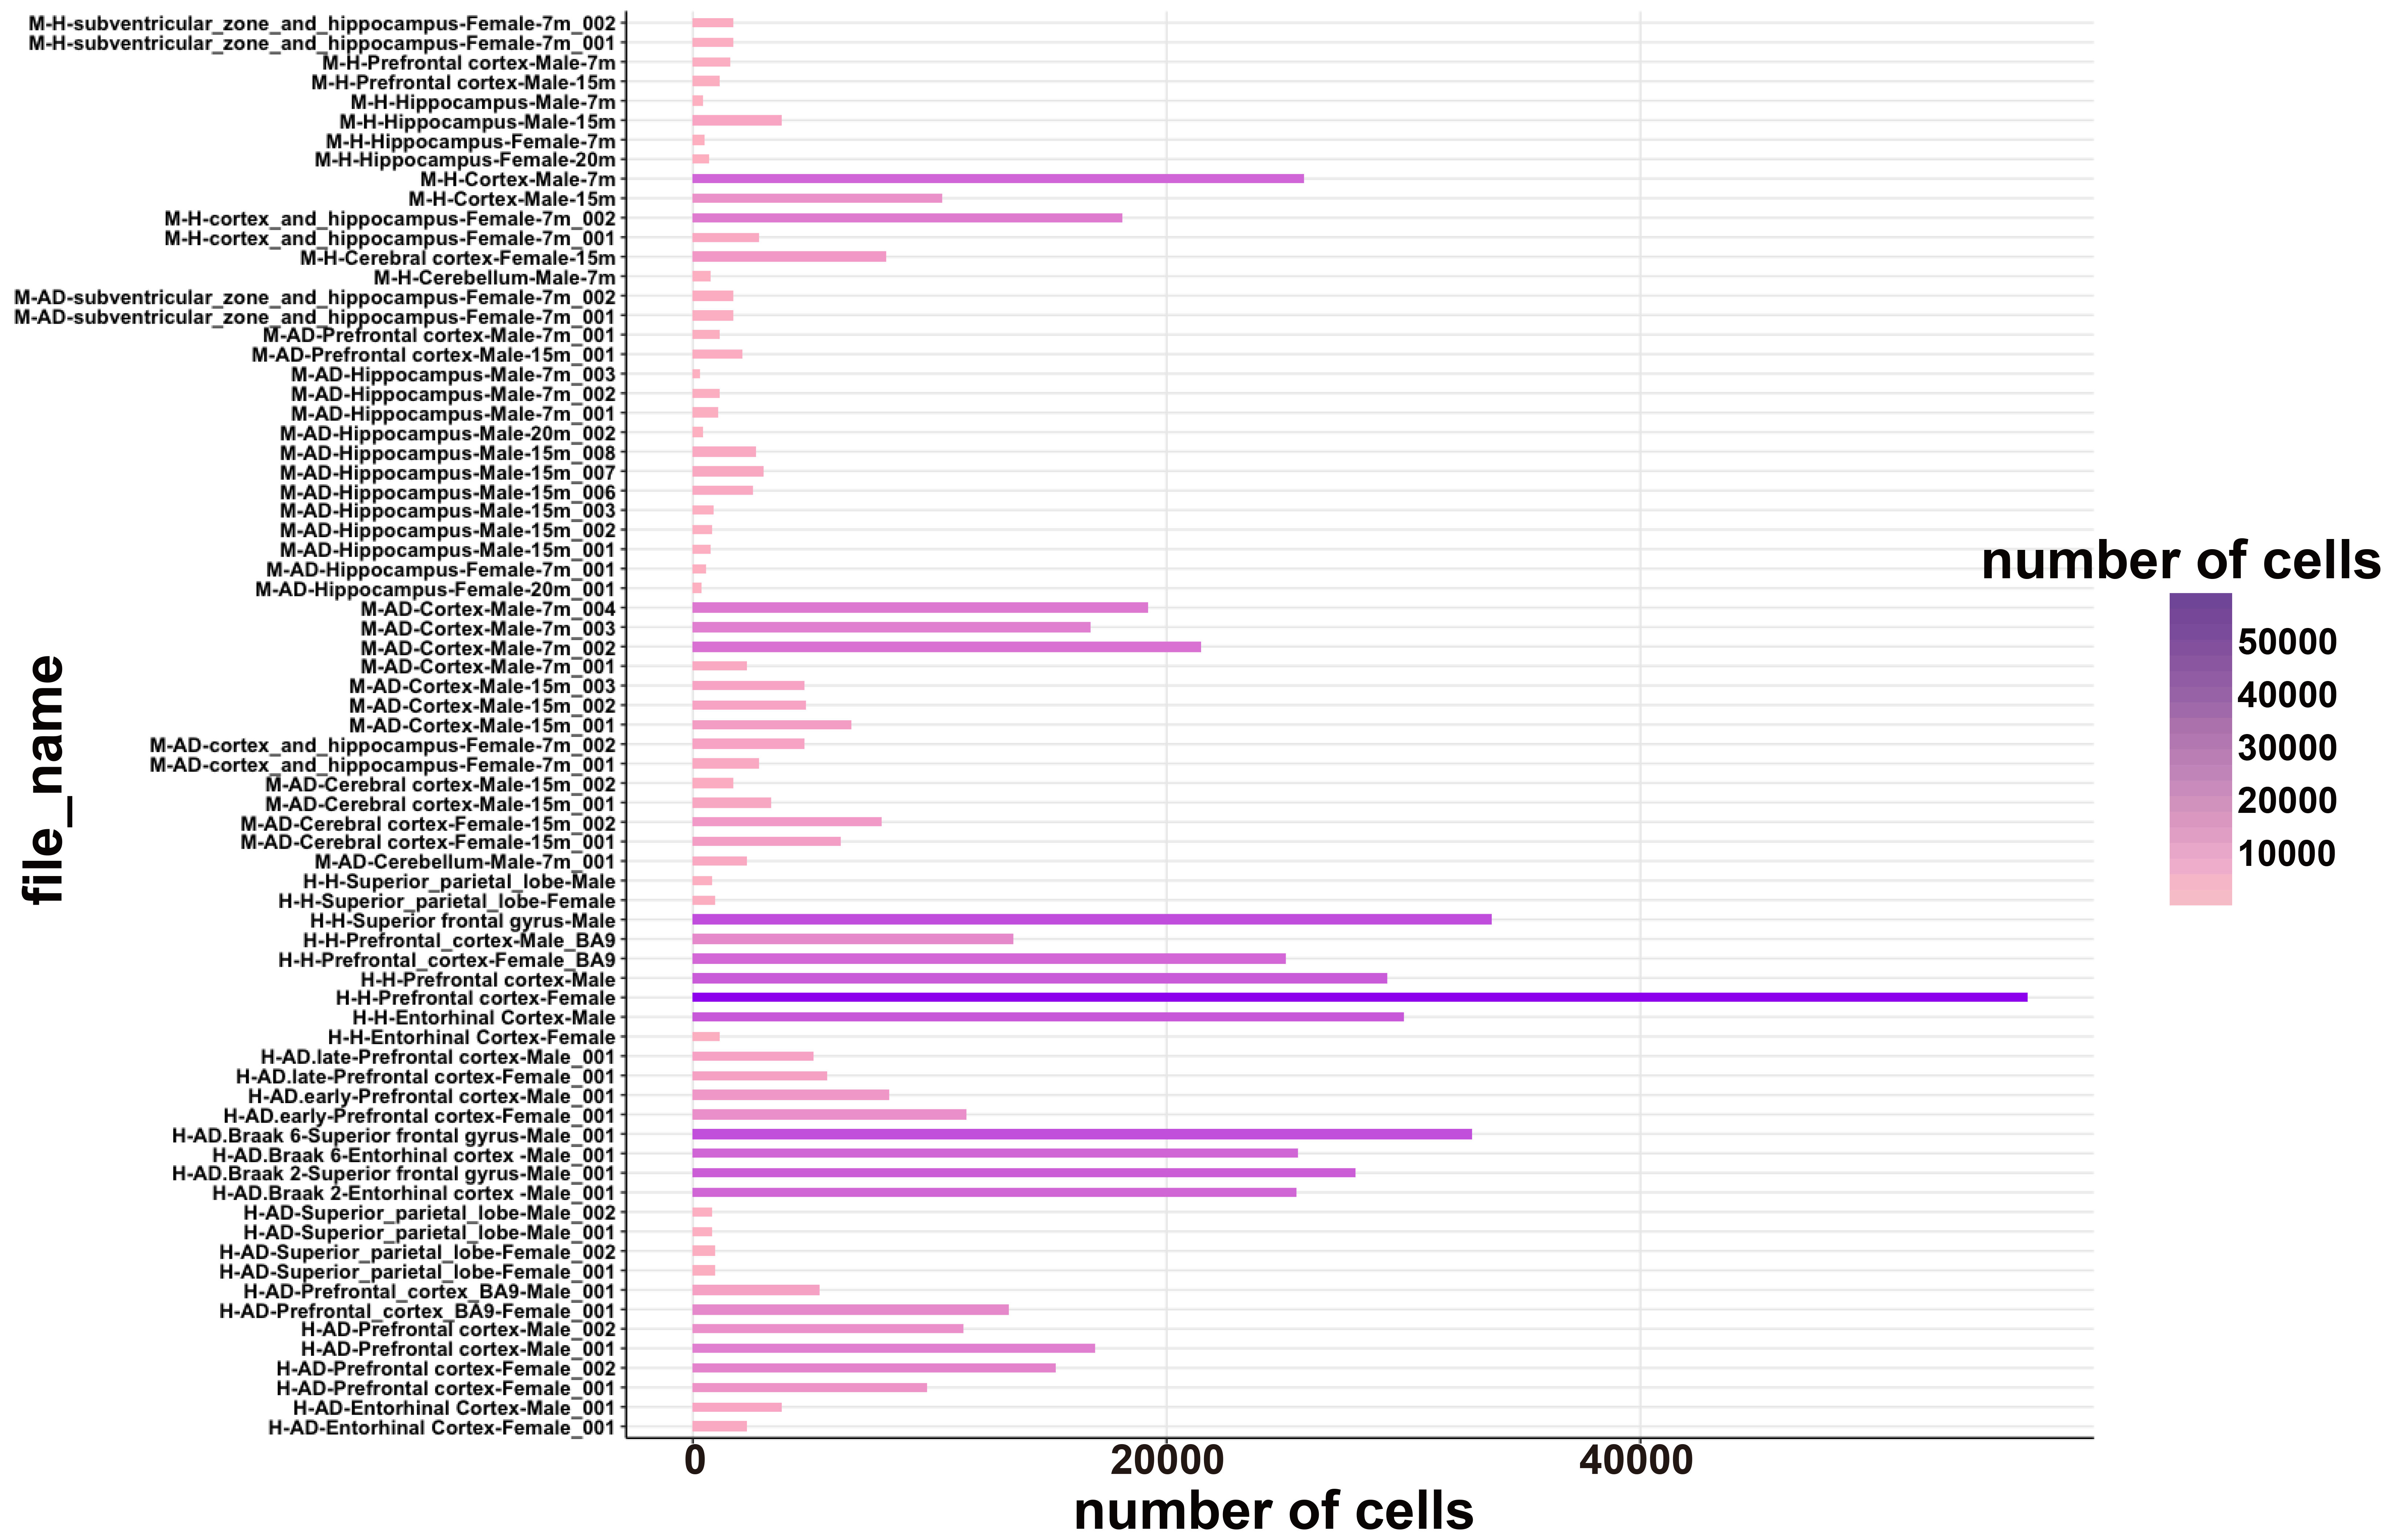
The scREAD contains 73 files in total, which are redefined from 17 existing human and mouse AD scRNA-Seq & snRNA-Seq datasets from the public domain. These files are redefined according to species, gender, brain region, disease or control, and age. The number of cells in each of these 73 files is shown in the following figure. The x-axis represents the number of cells of each file, and the y-axis represents the file names of these 73 files. The color intensity of the bar stands for the number of cells, i.e. the darker of the color represents the more cell numbers in the corresponding file.
The following figure represents the distribution of the species, gender, condition, and brain region for these 73 files. For each panel in this figure, the color of the bar stands for the number of files, the darker the color is the more files in the corresponding factor.
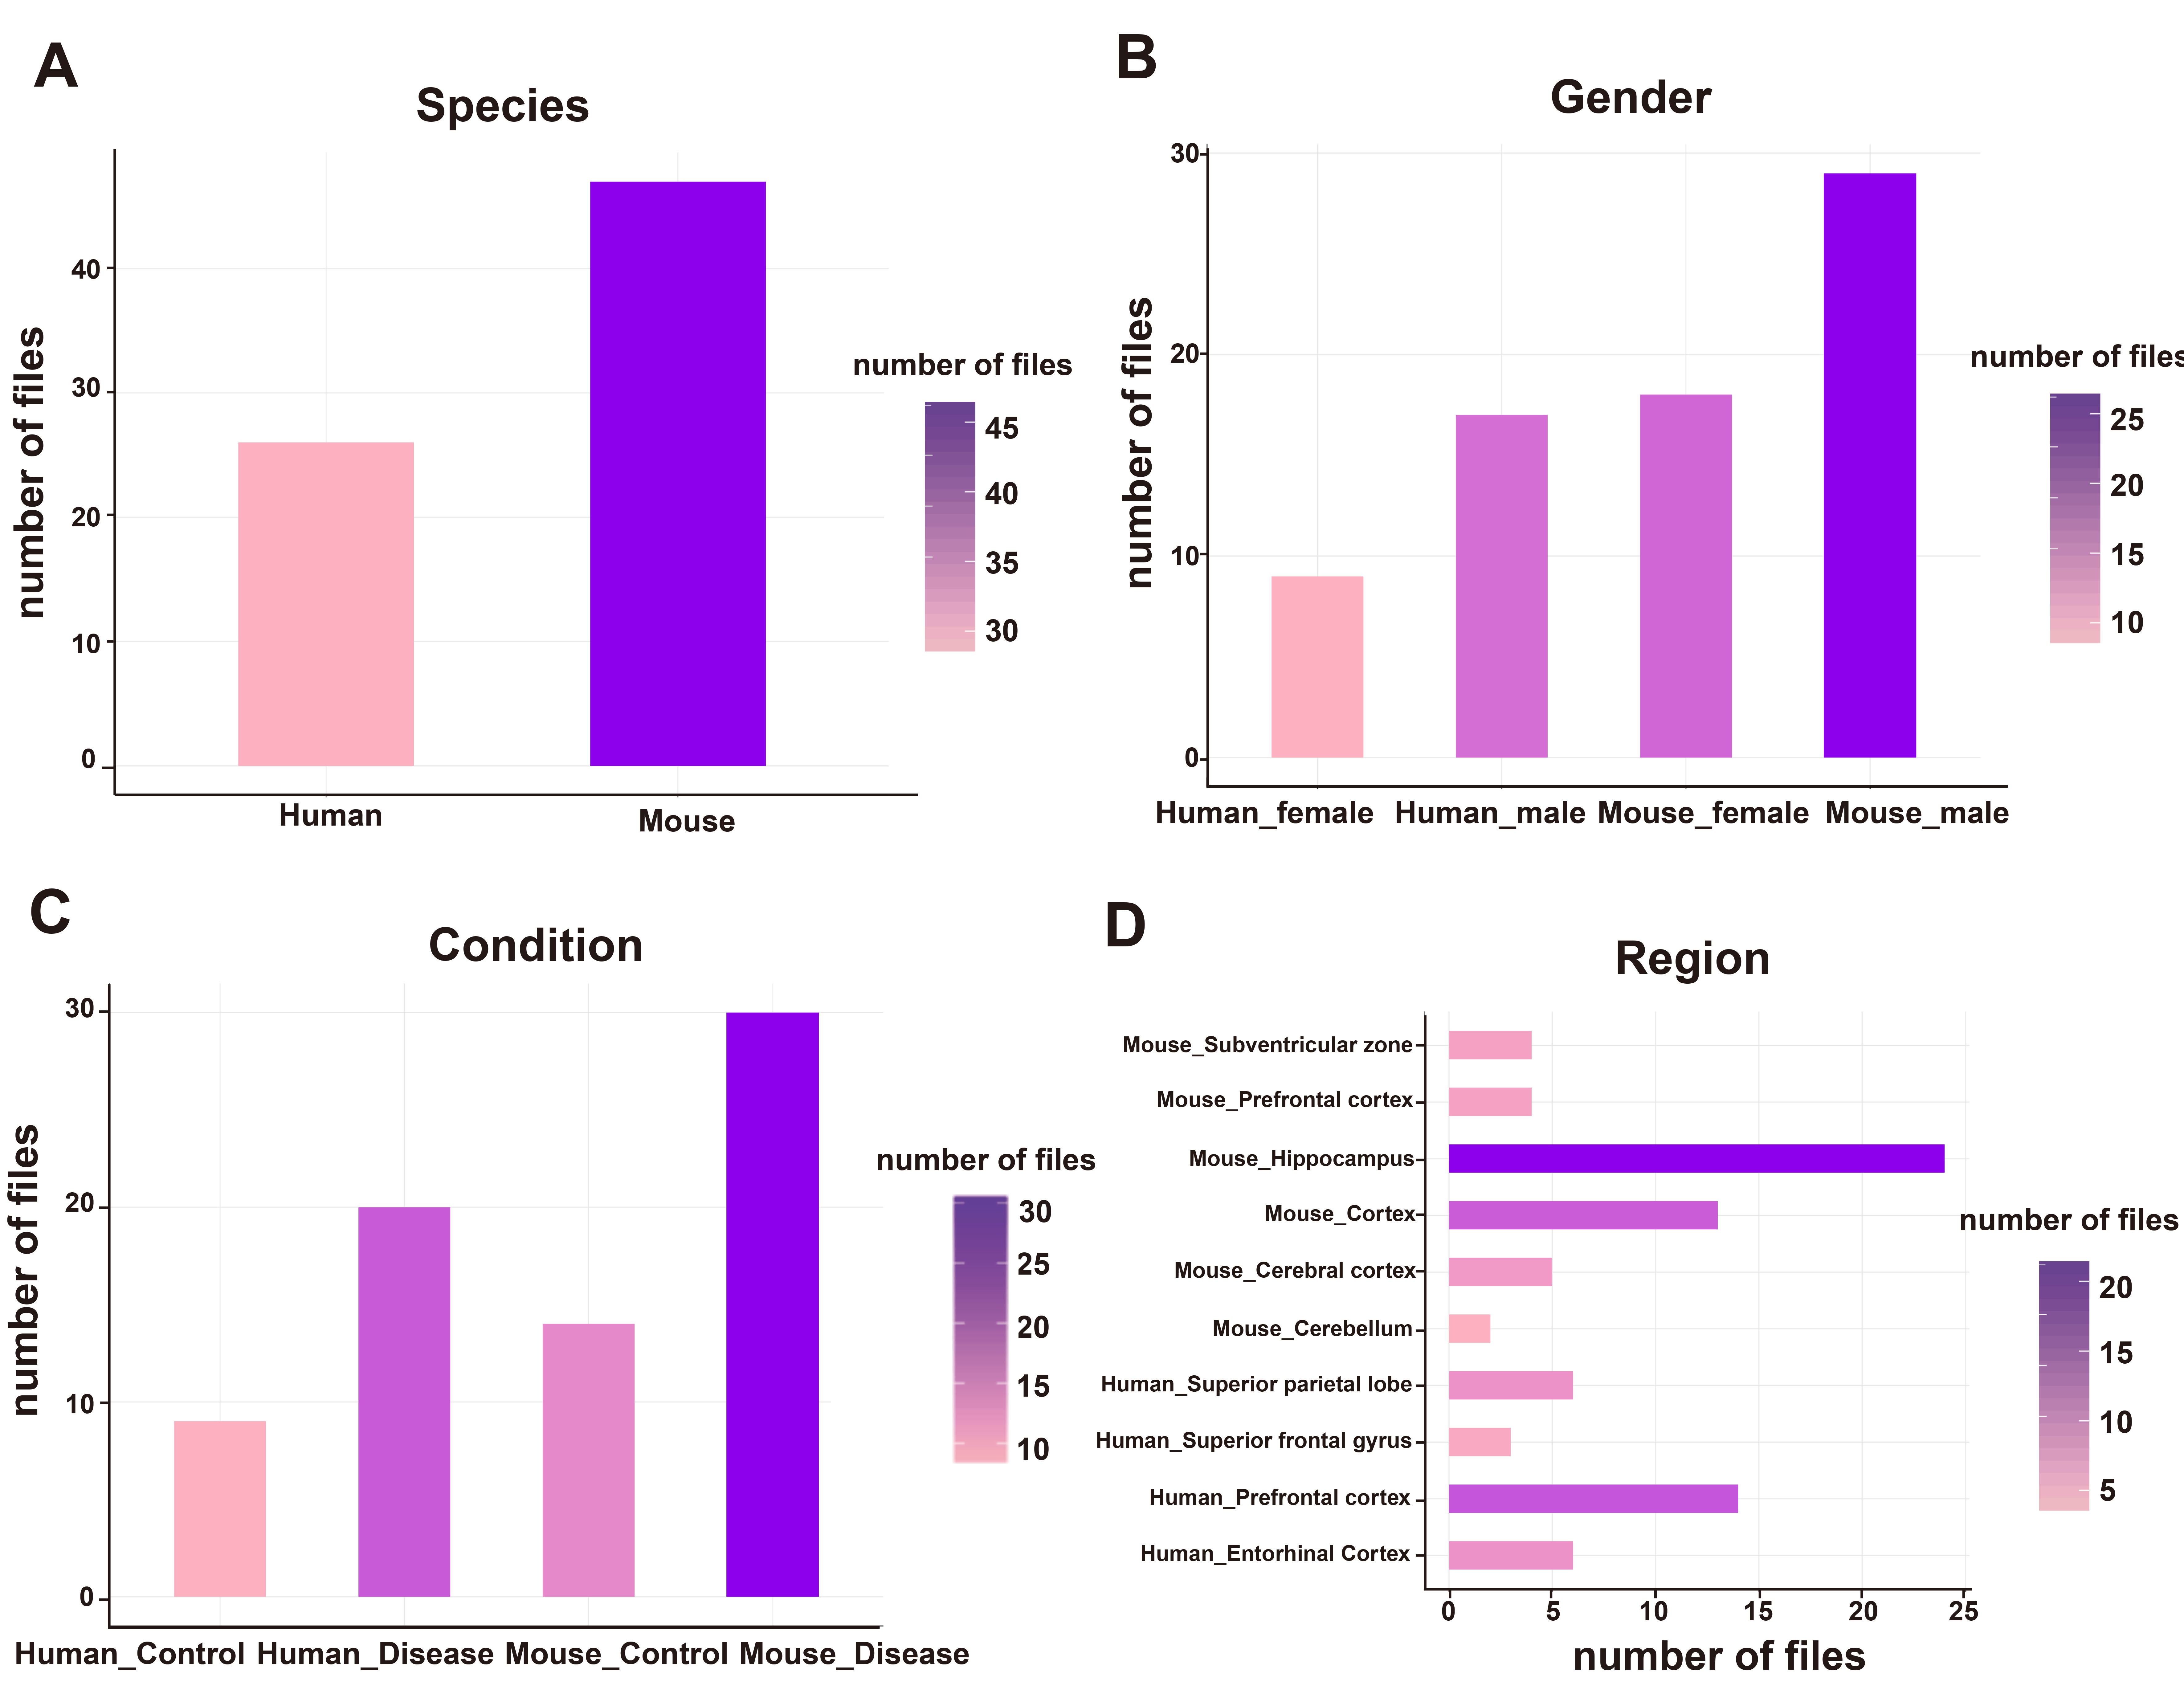
(A) X-axis represents the species are covered in the 73 files, and y-axis represents the numbers of files for human and mouse species. (B) X-axis represents the gender information is covered in the 73 files, and y-axis represents the numbers of files for each element. (C ) X-axis represents the condition information is covered in the 73 files, and y-axis represents the numbers of files for each element. (D) X-axis represents the numbers of files for each element, and y-axis represents the brain regions that are covered in the 73 files.
How can we define different mouse age stages?
The choice of rodent age should be given more consideration, as it improves the quality and relevance of the data obtained, and reduces variability. As for the age of mice used, it depends on the development or senescence of the system being studied. For example, Flurkey et al. defined a mature adult C57BL6/J mouse as 3–6 months (equivalent in this analysis to 20–30 human years), a middle-aged mouse as 10–14 months (equivalent to 38–47 human years) and an old mouse as 18–24 months (equivalent to 56–69 human years). We, therefore, define the different mouse age stages in our database as shown in the following table:
| Age_Stage | Range of ages |
|---|---|
| 2 months | 1-2 months |
| 7 months | 4-7 months |
| 15 months | 10-15 months |
| 20 months | 20 months |
What is a control atlas?
We constructed 23 control cell atlases of human and mouse based on 17 datasets, which cover 10 brain regions, two genders, and three different mouse age stages. Cell types of these 23 control atlases were clustered using Seurat and SCINA based on known cell type markers that collected from literature and PanglaoDB.
How to interpret the control atlas?
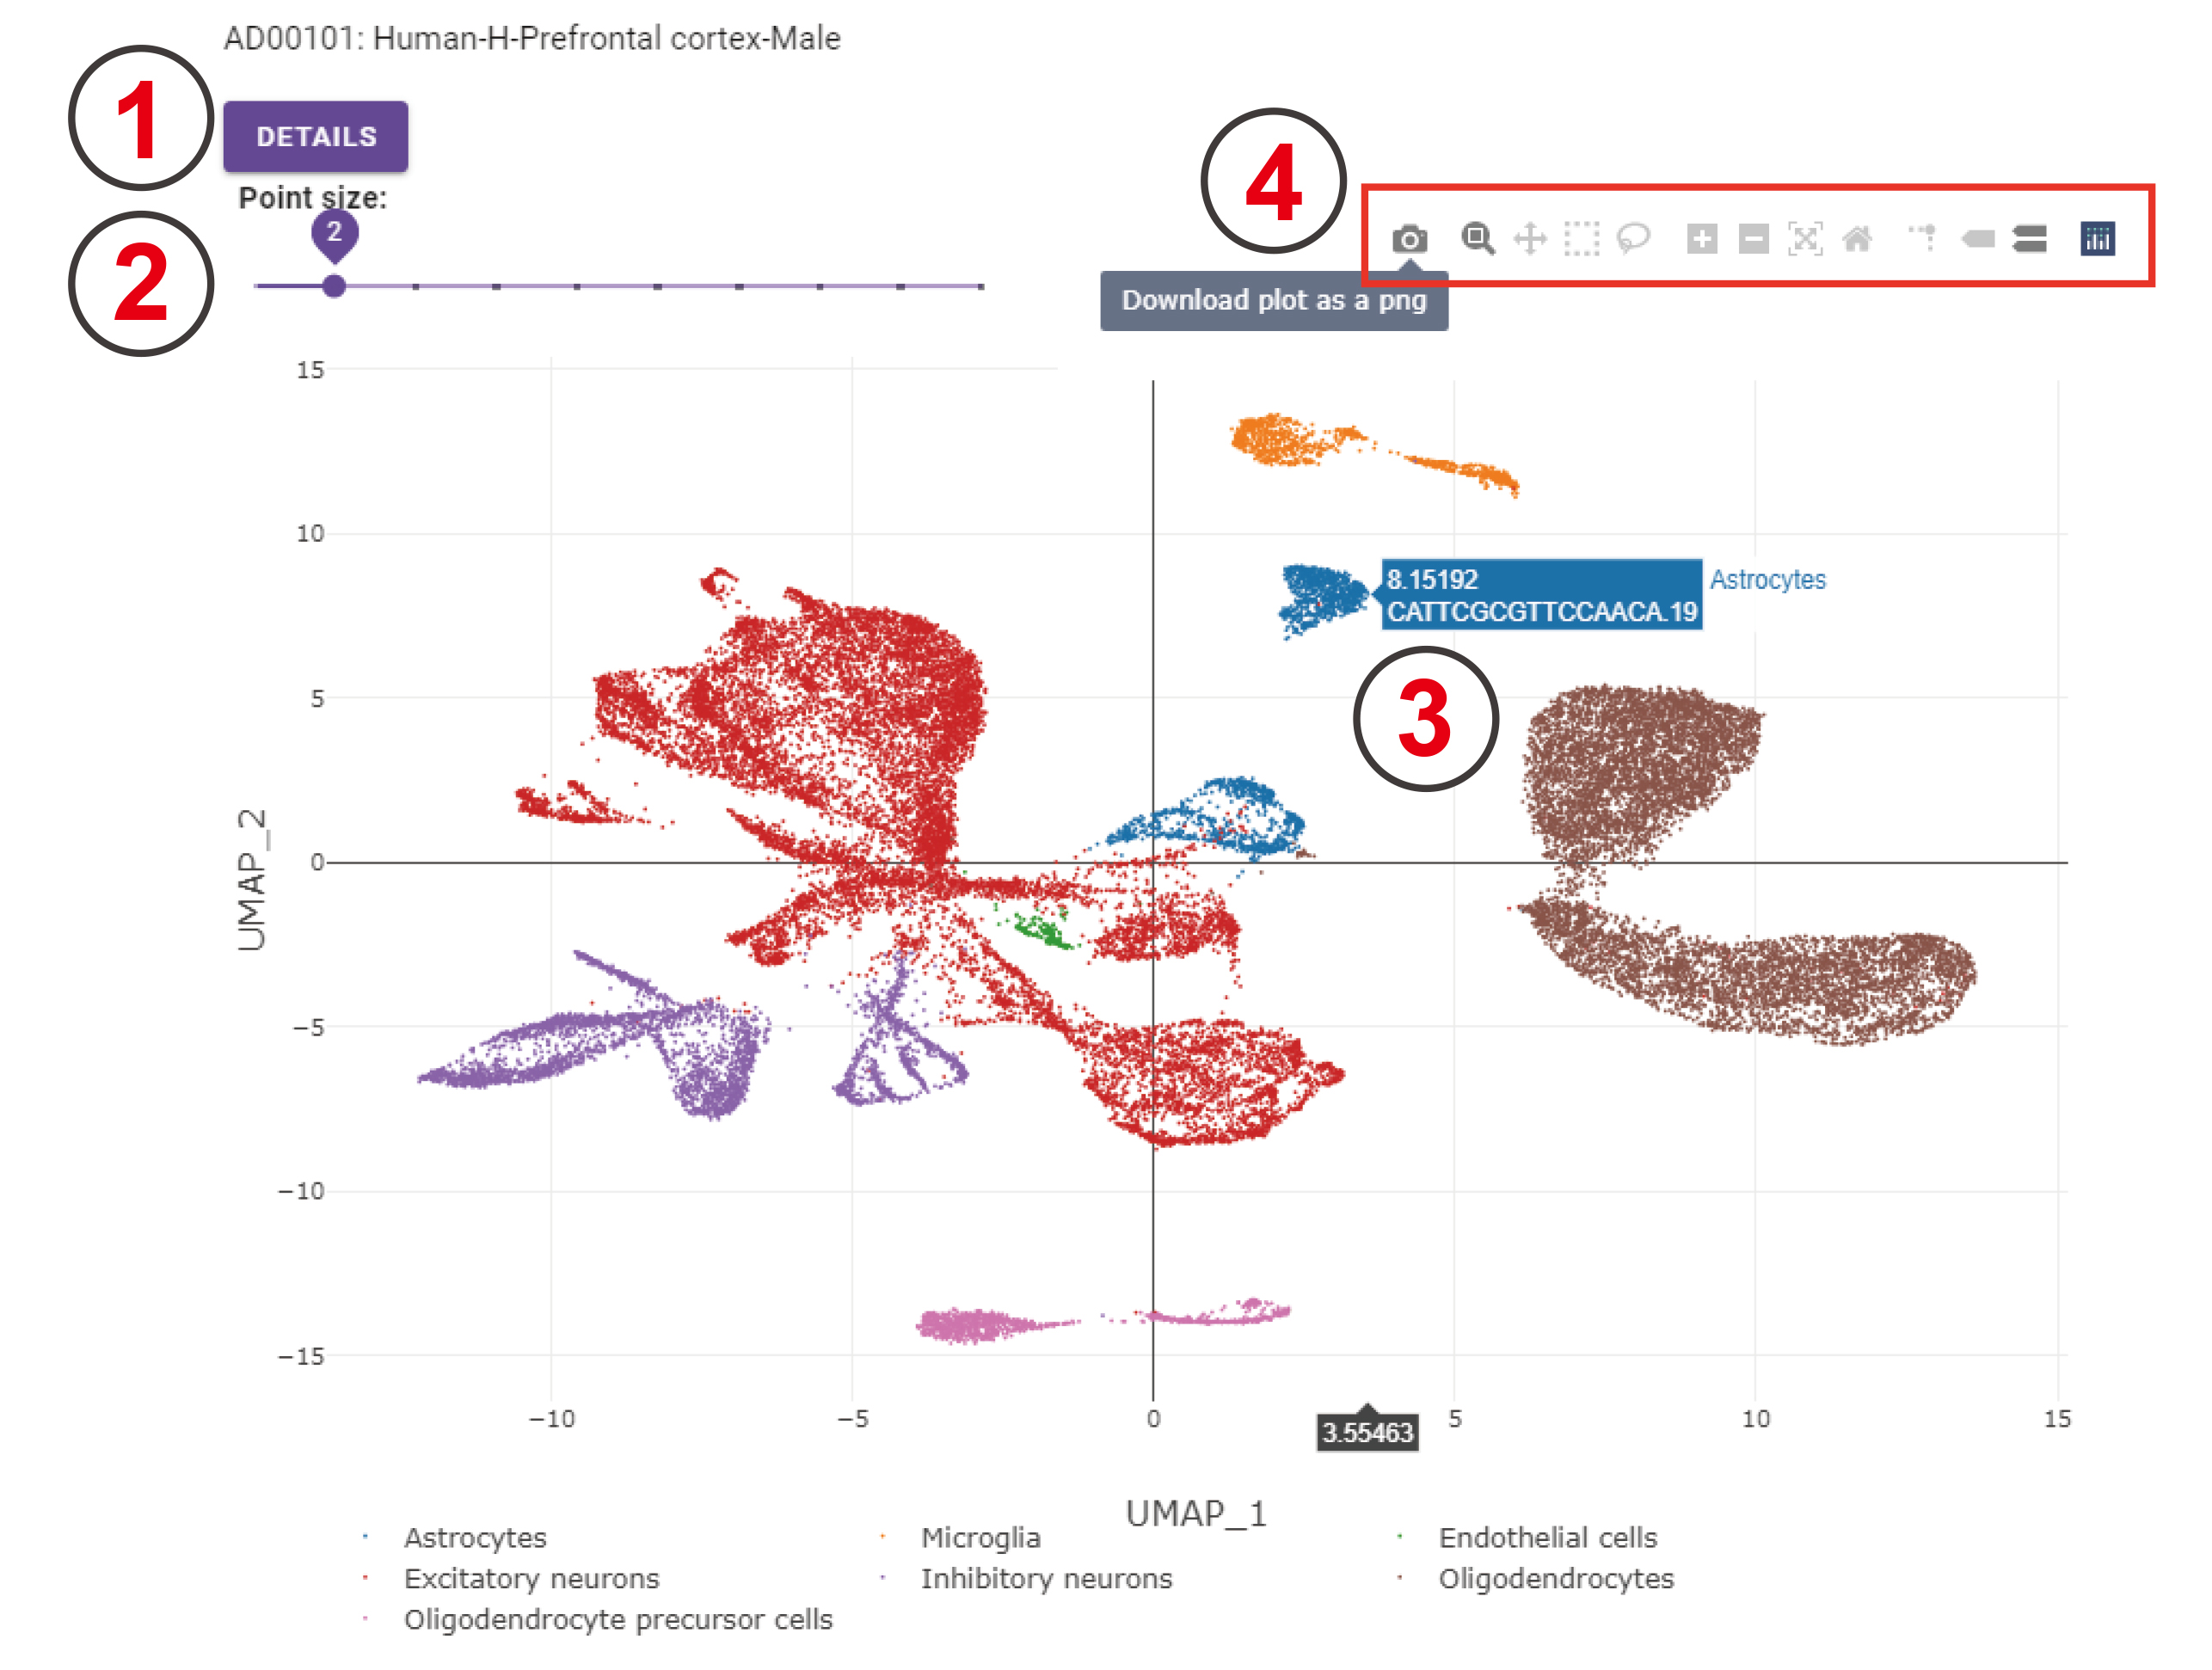
This is the UMAP of control cells coming from the prefrontal cortex region of human male datasets.
- Clicking the ‘DETAILS’ button will navigate to the analysis result page of this dataset.
- The point size on this UMAP can be adjusted by clicking the point on this sliding bar. The point size ranges from 1 to 10.
- A floating window will appear when to move your cursor on cells, indicating the belonging cell type, cell name, and the UMAP coordinate.
- This bar has 11 options; you can choose each option by clicking it and the corresponding UMAP will be changed as you change your options. For example, you can download this UMAP by clicking the ‘Download plot as a png’ button.
Which cell types are covered in scREAD?
There are eight cell types covered in our database. They are Astrocytes, Endothelial cells, Excitatory neurons, Inhibitory neurons, Microglia, Oligodendrocytes, Oligodendrocyte precursor cells, and Pericytes.
Where can I find subclusters?
The subcluster information can be found at the ‘Cell Clustering’ part. For each cell type, we have done the subcluster finding analysis.
What are the evaluation indexes for identified cell types?
- If benchmark labels are provided from the original study, the identified cell labels will be evaluated by the Adjusted Rand Index (ARI).
- If benchmark labels are not provided from the original study, the predicted cell types will be evaluated by calculating the silhouette score that measures how similar a cell is to its type compared to other clusters.
What is differential gene expression analysis?
We categorized the experiments for differential gene expression as one of the following conditions: AD versus control and AD versus AD in the same species under the same gender, brain region, and age. The differential gene expression analysis under each condition can be accessed through the Seurat FindMarkers function. All results were scaled by cell types and presented in the tables, allowing users to explore the differential expression of interesting genes across different conditions.
The cases how to achieve differential expressed genes between different conditions (Condition 1 v.s. Condition 2) for diverse cell types in scREAD are showed in the following table:
| Species | If in the same region | Condition 1 | Condition 2 |
|---|---|---|---|
| Human | Yes | Disease | Control |
| Mouse | Yes | Disease | Control |
| Human | Yes | Disease | Disease |
| Mouse | Yes | Disease | Disease |
| Human | No | Disease | Disease |
| Mouse | No | Disease | Disease |
Note: The comparisons are all in the same gender and age.
What is enrichment analysis?
Enrichment analysis is a computational method for inferring knowledge about an input gene set by comparing it to annotated gene sets representing prior biological knowledge. Enrichment analysis checks whether an input set of genes significantly overlaps with annotated gene sets. For more information, you can read this excellent review about enrichment analysis here.
What are regulons and cell-type-specific regulons (CTSRs) and why are they important?
The term regulon was first introduced by Maas et al. in 1964, intended to name a maximal group of co-regulated genes, which may be scattered in a genome without apparent patterns in terms of their genomic locations.Based on that, cell-type-specific regulons (CTSRs) are defined as a group of genes, which receive similar regulatory signals in a specific cell type, hence tending to have similar expression patterns and share conserved motifs in this cell type. A successful elucidation of CTSRs will substantially improve the identification of transcriptionally co-regulated gene modules, realistically allowing reliable prediction of global transcription regulation networks encoded in a specific cell type.
How to interpret the CTSRs?
- Regulon heatmap
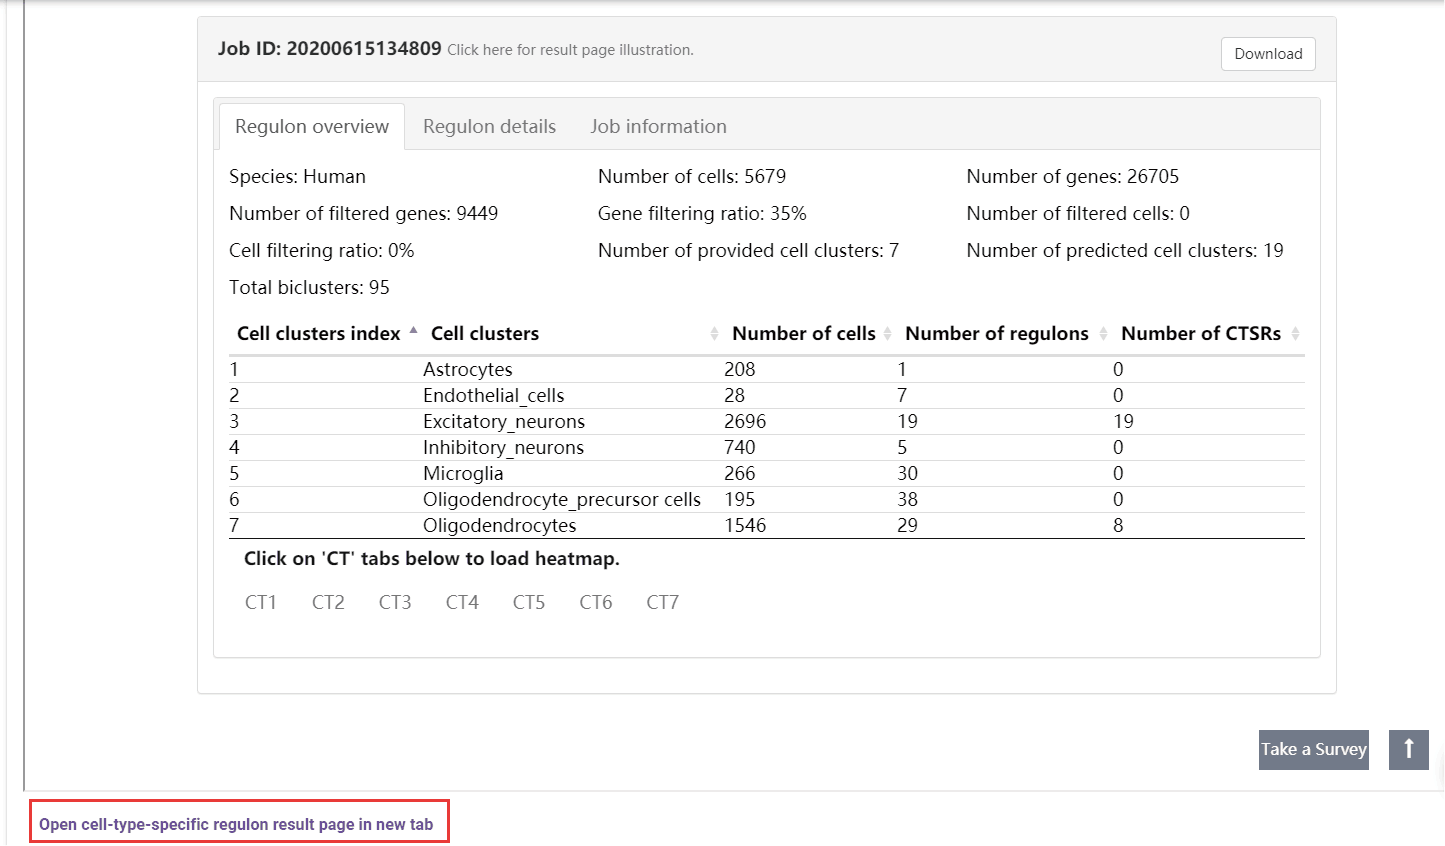
A table summarizes the clusters shows the overall cell number and regulon number in each cluster. Users can jump into the IRIS3 to see the detail results of this job by clicking the ‘Open cell-type-specific regulon result page in new tab’ button. In the table, the index number will be given to represent CTSRs. A cell-gene-regulon heatmap will be displayed for each cell type by clicking on the CT## tab. See the figure details below.
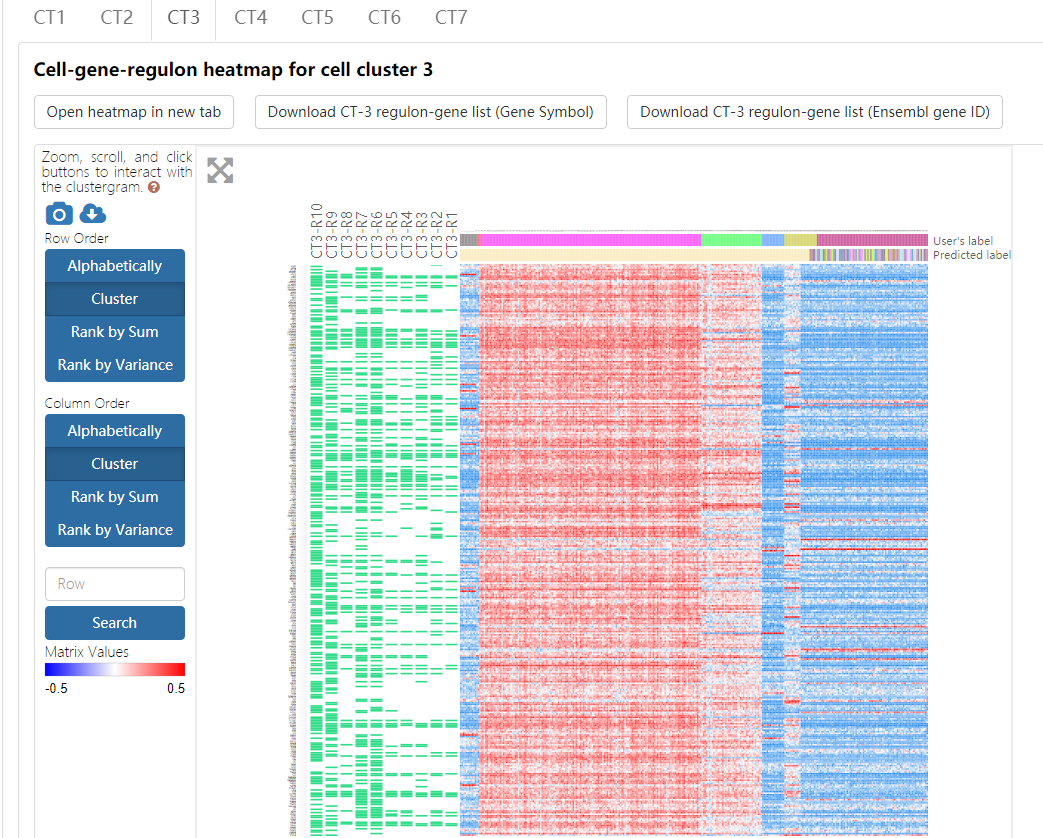
The heatmap, empowered by Clustergrammer, showcases the expression pattern of genes from the top ten regulons in the corresponding cell type. To explore details about Clustergrammer, please read the Clustergrammer documentation.
- Both gene compositions of regulons and their expression values across different cell types can be intuitively displayed in such a heatmap. Regulons are ranked in increasing order of the empirical p-values of regulon specificity scores (RSS) as described above, and a regulon is named as CTn-Rm with n representing the index of cell type and m represents the regulon rank. Due to the space limitation, only the top ten regulons and their corresponding genes are showcased in the heatmap, and the component genes of each regulon are indicated as green rectangles. The heatmap records the log-transformed expression level of each top-ten-regulon-covered gene across all cells.
- Cell names, original cell type labels, and cell types labels predicted by Seurat are shown on the heatmap. This heatmap can also be sorted by gene and cell by double-clicking on the appropriate area on the image. Conveniently, a series of gene enrichment tests can be directly performed on the heatmap using the integrated Enrichr function in the Clustergrammer framework.
- This heatmap can be downloaded by clicking on the top-left buttons above the heatmap and choosing the ‘Take a snapshot’ option.
- Regulon details
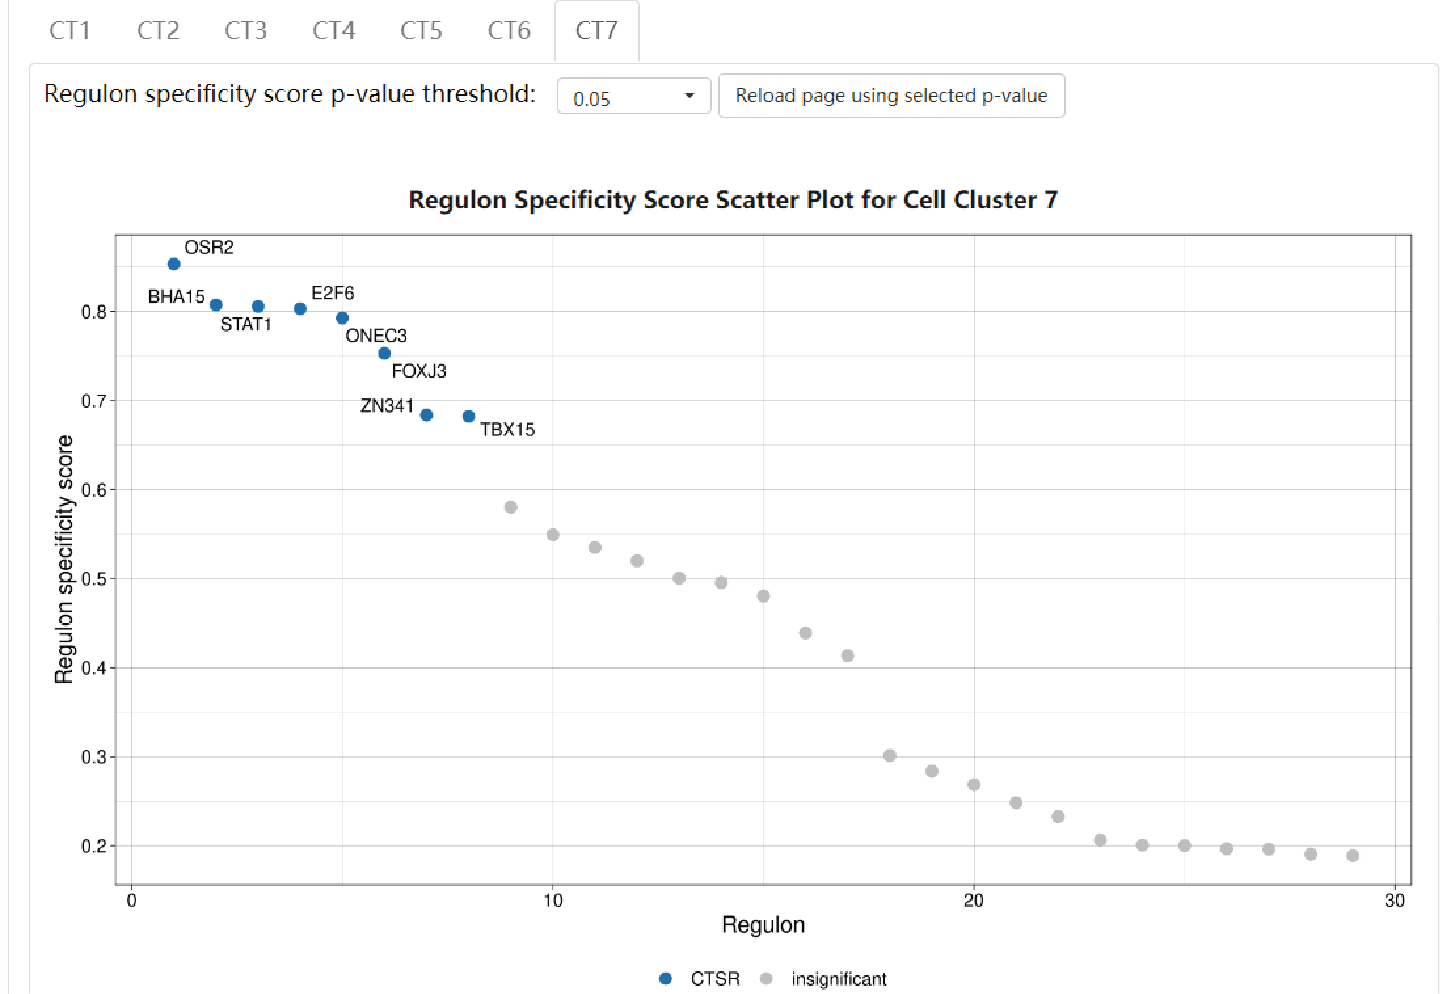
Regulon results are separately showcased in each cell type. Click on the “CT#” button to switch to see results in other cell types. A scatter plot shows the distribution of RSS of each regulon. CTSRs are marked as blue dots with their representative TF names besides, and insignificant regulons are marked as grey dots. Detailed information of each regulon can be found in IRIS3.
What is IRIS3?
IRIS3 (Integrated Cell-type-specific Regulon Inference Server from Single-cell RNA-Seq) is an easy-to-use server empowered by over 20 functionalities to support comprehensive interpretations and graphical visualizations of identified CTSRs. CTSR data can be used to reliably characterize and distinguish the corresponding cell type from others and can be combined with other computational or experimental analyses for biomedical studies. CTSRs can, therefore, aid in the discovery of major regulatory mechanisms and allow reliable constructions of global transcriptional regulation networks encoded in a specific cell type. The broader impact of IRIS3 includes, but is not limited to, investigation of complex diseases hierarchies and heterogeneity, causal gene regulatory network construction, and drug development. IRIS3 is freely accessible from https://bmbl.bmi.osumc.edu/iris3/ with no login requirement. More information about this paper can be found here.
What are the input files of the scREAD?
The required input file is a gene expression matrix with three acceptable formats, compressed files are encouraged to decrease the uploading time.
- A single txt, tsv or csv formatted gene expression matrix. The compressed format (gzip) is accepted
- An hdf5 feature barcode matrix.
- The three gzipped files recording information of barcodes, features, and gene expressions in the 10X genomics output folder.
Identifiers can be represented as Gene Symbols (e.g., HSPA9), Ensembl Gene IDs (e.g., ENSG00000113013), or Transcript IDs (e.g., ENSMUST00000074805). Human and mouse genes are annotated with respect to the reference genome using the org.HS.eg.db R package and org.Mn.eg.db package, respectively.
How to interpret the file names?
The file name is composed of six parts, they are species, condition, region, gender, age, and code numbers based on the string order of the file_name. Here are two examples showing how to read the file_name column:
| file_name | species | condition | region | gender | age | code_numbers |
|---|---|---|---|---|---|---|
| M-H-Cerebellum-Male-7m | Mouse | Control | Cerebellum | Male | 7 months | NULL |
| H-AD-Prefrontal cortex-Female_001 | Human | Disease | Prefrontal cortex | Female | 75 – 90+ years | 001 |
Note: For control datasets across different brain regions with different genders in different species, each of which corresponded to only one file, so it doesn’t have any code_numbers here.
How to interpret the data_id?
The data_id name is composed of three parts, they are Alzheimer’s disease (the two letters), the region of different species (the first three numbers), and code numbers (the last two numbers). Here are two examples showing how to read data_id:
| data_id | Alzheimer’s disease | Region | code_number |
|---|---|---|---|
| AD00101 | AD | region of human (001) | 01 |
| AD00402 | AD | region of mouse (004) | 02 |
Here is the table showing which brain regions are the first three letters corresponded to:
| Three letters | Brain Region |
|---|---|
| 001 | Human prefrontal cortex |
| 002 | Human entorhinal cortex |
| 003 | Mouse cortex |
| 004 | Mouse cerebral cortex |
| 005 | Mouse cerebellum |
| 006 | Mouse prefrontal cortex |
| 007 | Mouse hippocampus |
| 008 | Human superior frontal gyrus |
| 009 | Mouse cortex and hippocampus |
| 010 | Mouse subventricular zone and hippocampus |
| 011 | Human prefrontal cortex (BA9) |
| 012 | Human superior parietal lobe |
Note: We separated the mouse brain region of cortex from the cerebral cortex because the corresponding datasets used different mouse models. We separated the human prefrontal cortex brain region because the corresponding braak stages are different.
What is fst format?
Multithreaded serialization of compressed data frames using the ‘fst’ format. The ‘fst’ format allows for random access of stored data and compression with the LZ4 and ZSTD compressors created by Yann Collet.
You can see more information about Package ‘fst’ here.
Where does scREAD store the data uploaded by users?
We will ask for your permission when we want to store the data uploaded by you into our database. Then we will store the data in the background of our database.
How can I submit my AD scRNA-Seq data to scREAD to do an analysis?
The users can submit their AD scRNA-Seq dataset as well as the corresponding control dataset to scREAD to do all the analysis through Submit page.
Where can I find the source code?
The source code of scREAD can be accessed on GitHub.
How can I download the datasets in scREAD?
The datasets of scREAD can be downloaded from Download page.
What are the future plans of scREAD?
- Collect more AD scRNA-Seq & snRNA-Seq data from more brain regions, and build up healthy atlas in diverse brain regions of human, mouse and extend to other species.
- Collect AD single-cell omics data, such as scATAC-seq data, and achieve more comprehensive analysis results based on single-cell multiple omics data.
- Identify significant differentially expressed regulons for each cell type across different files by using IRIS3.
What computational tools are used in scREAD?
| Tools | Publication |
|---|---|
| IRIS3 | Anjun Ma, Cankun Wang, Yuzhou Chang, Faith H Brennan, Adam McDermaid, Bingqiang Liu, Chi Zhang, Phillip G Popovich, Qin Ma, IRIS3: integrated cell-type-specific regulon inference server from single-cell RNA-Seq, Nucleic Acids Research, gkaa394, https://doi.org/10.1093/nar/gkaa394 |
| Seurat | Stuart T*, Butler A*, Hoffman P, Hafemeister C, Papalexi E, Mauck WM, Hao Y, Stoeckius M, Smibert P, Satija R. Comprehensive Integration of Single-Cell Data Cell. 2019. DOI:https://doi.org/10.1016/j.cell.2019.05.031 |
| Harmony | Korsunsky, I., Millard, N., Fan, J. et al. Fast, sensitive and accurate integration of single-cell data with Harmony. Nat Methods 16, 1289–1296 (2019). https://doi.org/10.1038/s41592-019-0619-0 |
| Polychrome | Coombes, K., Brock, G., Abrams, Z., & Abruzzo, L. (2019). Polychrome: Creating and Assessing Qualitative Palettes with Many Colors. Journal of Statistical Software, 90(Code Snippet 1), 1 - 23. doi:http://dx.doi.org/10.18637/jss.v090.c01 |
| Destiny | Angerer P, Haghverdi L, Büttner M, Theis F, Marr C, Büttner F (2015). “destiny: diffusion maps for large-scale single-cell data in R.” Bioinformatics, 32(8), 1241 1242 1243. doi: 10.1093/bioinformatics/btv715, More information at http://www.helmholtz-muenchen.de/icb/destiny, http://bioinformatics.oxfordjournals.org/content/32/8/1241. |
| SCINA | Zhang, Z., Luo, D., Zhong, X., Choi, J. H., Ma, Y., Wang, S., Mahrt, E., Guo, W., Stawiski, E. W., Modrusan, Z., Seshagiri, S., Kapur, P., Hon, G. C., Brugarolas, J., & Wang, T. (2019). Scina: Semi-supervised analysis of single cells in silico. Genes, 10(7), [531]. https://doi.org/10.3390/genes10070531 |
Why does scREAD use PCA instead of CCA or LSI for the dimensional reduction in the identification of disease dataset cell types?
In the identification of disease cell types, we used Seurat’s FindTransferAnchors and TransferData function to transfer cell types from the control atlas to disease datasets, which project PCA structure from the query (disease dataset) onto the reference (control atlas). PCA is recommended when reference and query datasets are from scRNA-seq. CCA is considered better captures the shared feature correlation structure across single-cell modalities. LSI is considered better captures the ‘internal’ structure of ATAC-seq data in the case of scRNA-seq to scATAC-seq transfer.
What is the scREAD overall pipeline?
Our database organically integrates multiple state-of-the-art tools, including IRIS3, SCINA, Seurat, and IRIS-EDA. These tools are either reputed or have been justified with the best performance in the analytical area.
1. Construction of Human and Mouse control atlas
Human and Mouse control atlases come from the 15 scRNA-Seq & snRNA-Seq studies. Genes detected in less than 3 cells and cells detected in less than 200 genes were filtered out. Principal component analysis (PCA) was performed to obtain a small number of principal components, 25 PCA components were used as input of Uniform Manifold Approximation and Projection (UMAP). Initial clustering was performed using Seurat’s v3.1.5 SNN graph clustering using the FindClusters function with a resolution of 0.8.
SCINA is an R package that leverages prior marker genes information and simultaneously performs cell type clustering and assignment for known cell types, SCINA shows top performances among prior-knowledge classifiers when high-quality marker genes were provided. Each cell was assigned a cell type based on a manually created marker gene list file using SCINA v1.2.0, the cells with unknown labels marked by SCINA were first compared with predicted clusters from Seurat, then the unknown labels were assigned to the most dominate cell types within the predicted clusters.
scREAD v1 marker genes
| Astrocytes | Endothelial cells | Excitatory neurons | Inhibitory neurons | Microglia | Oligodendrocytes | Oligodendrocyte precursor cells | Pericytes |
|---|---|---|---|---|---|---|---|
| GFAP | FLT1 | SLC17A6 | SLC32A1 | IBA-1 | OLIG2 | VCAN | AMBP |
| EAAT1 | CLDN5 | SLC17A7 | GAD1 | P2RY12 | MBP | CSPG4 | HIGD1B |
| AQP4 | VTN | NRGN | GAD2 | CSF1R | MOBP | PDGFRA | COX4I2 |
| LCN2 | ITM2A | CAMK2A | TAC1 | CD74 | PLP1 | SOX10 | AOC3 |
| GJA1 | VWF | SATB2 | PENK | C3 | MOG | NEU4 | PDE5A |
| SLC1A2 | FAM167B | COL5A1 | SST | CST3 | CLDN11 | PCDH15 | PTH1R |
| FGFR3 | BMX | SDK2 | NPY | HEXB | MYRF | GPR37L1 | P2RY14 |
| NKAIN4 | CLEC1B | NEFM | MYBPC1 | C1QA | GALC | C1QL1 | ABCC9 |
| AGT | CD93 | GRIN1 | PVALB | CD74 | ERMN | CDO1 | KCNJ8 |
| PLXNB1 | CDH5 | GLS | GABBR2 | CX3CR1 | MAG | EPN2 | CD248 |
| SLC1A3 | AIF-1 | ||||||
| TMEM119 |
2. Identification of Human and Mouse disease cell types based on the control atlas
Not all cells collected from patient samples are malignant, there are heterogeneous cells within individual patients, that is, normal healthy cells are included. In Granja et al.’s research, they defined these healthy cells as control-like cells. These control-like cells maintain distinct regulatory mechanisms and gene expression patterns compared to disease cells and will disturb the accurate identification of cancer cell clusters. Thus, the removal of control-like cells from disease data is critical to identify real disease-associated cells. Granja et al. used this strategy to remove control-like cells, and we used this strategy in scREAD to identify AD-associated cells. For each of the AD datasets in scREAD, the ratio of the control-like cells out of all the cells in this dataset is about 10%. We tested at Mathys et al.’s dataset, and found out the ARI scores between with control-like cells and without control-like cells has no significant difference. However, the ARI score of without control-like cells datasets is higher than with control-like cells datasets.
To determine whether cells from disease datasets are control-like, Harmony R package v1.0 was first used to integrate the disease dataset with its corresponding control atlas. Harmony shows similar ARI scores but having a significantly shorter run-time compared to other data integration tools. After the integration, cells were clustered using Seurat FindClusters function with a resolution of 4. A hypergeometric test was performed for each cluster using the number of cells from disease cells and the number of cells from the control atlas. Clusters were considered to be control-like if the hypergeometric test result was significant (p-value < 0.0001, Benjamini-Hochberg adjusted), and the cells from the disease dataset in control-like clusters were removed from the downstream analyses.
For the remaining disease cells, Seurat’s FindTransferAnchors function was used to find transfer anchors using PCA to project the control-atlas onto the disease dataset. Cell types were transferred using the TransferData function with PCA embeddings as the weighting anchors. The subclusters for each cell types were designated using Seurat FindClusters function for all cells in each identified cell type with a resolution of 0.8.
3. Identification of differentially expressed genes
Seurat’s FindAllMarkers and FindMarkers functions that utilize the MAST package were used to run DE testing on normalized gene expression data. Cell-type-specific genes were identified by performing DE testing between the cell type of interest and the average of the remaining cell types. Subcluster-specific genes were identified by performing DE testing between the subcluster of interest and the average of the remaining subclusters from the same cell type. For each cell type, several DE comparisons were performed within two different datasets, categorized from AD versus control, and AD versus AD in the same species under the same gender, brain region, and age. To regress out technical biases from different datasets, the dataset latent variables were added in all cross-dataset DE testing. All of the above-mentioned DE results can be sent to Enrichr web server real-time against different functional annotation databases to identify the enriched KEGG pathways, Gene Ontology(GO), etc.
4. Identification of CTSRs
Cell-type-specific regulons (CTSRs) are defined as a group of genes, which receive similar regulatory signals in a specific cell type, hence tending to have similar expression patterns and share conserved motifs in this cell type. A successful elucidation of CTSRs will substantially improve the identification of transcriptionally co-regulated gene modules, realistically allowing reliable prediction of global transcription regulation networks encoded in a specific cell typeThe CTSRs analysis in scREAD is performed using default IRIS3 settings.